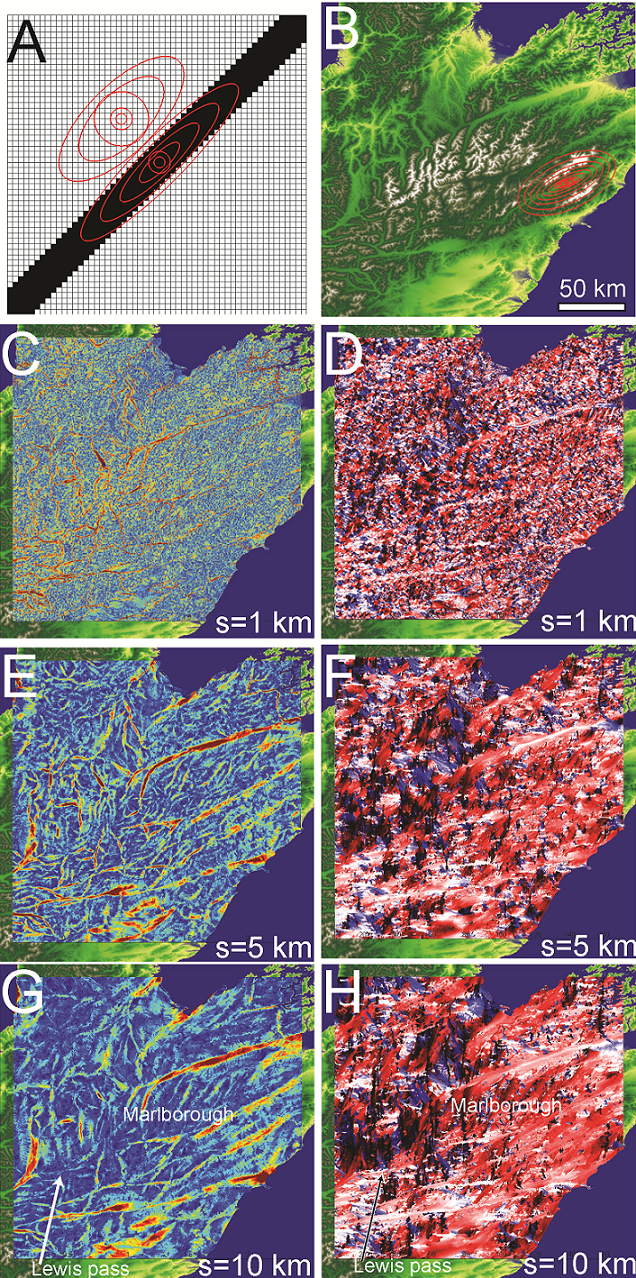
Topographic Anisotropy Figure 6
Figure 6: A) Low relief trough bisecting high relief plateau; a simplified replication of fault damage influenced topography. B) Anisotropy measured at single point in Marlborough. Anisotropy measured up to maximum wavelength of 37.5 km. C) Anisotropy magnitude and D) orientation map at 1 km, E) F) 5 km, and G) H) 10 km wavelength.
