Topographic Anisotropy Figure 4
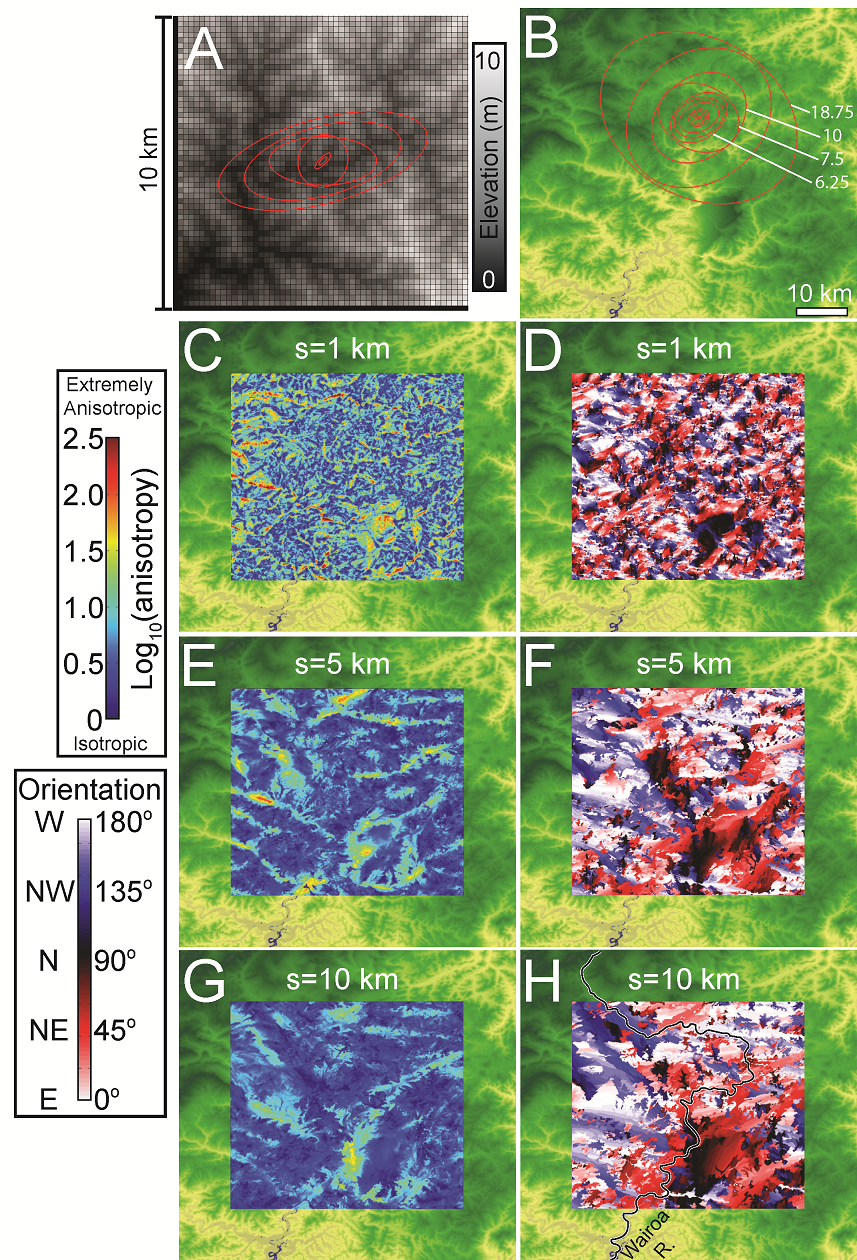
Figure 4: A) Dendritic surface created from a stream power-based landscape evolution model created on a uniform substrate. Greyscale: black is low, white is high elevation for this and all proceeding synthetic examples. Anisotropy of single point represented by red ellipses for this and all following figures (see Figure 2E,F). B) Anisotropy measured at single point in Wairoa region. Numbers represent the wavelength in kilometers for the indicated ellipses. Anisotropy measured up to maximum wavelength of 18.75 km. See Figure 1A for elevation color scale for this and all proceeding natural examples. C) Anisotropy magnitude (Equation 4) and D) orientation map at 1 km, E) F) 5 km, and G) H) 10 km wavelength. Color scales for both map types on left are used for this and all following figures.
