Difference between revisions of "Topographic Anisotropy Figure 10"
| (3 intermediate revisions by the same user not shown) | |||
| Line 1: | Line 1: | ||
| − | [[File:Vario figures copy Page 10.png|center| | + | [[File:Vario figures copy Page 10.png|center|650px]] |
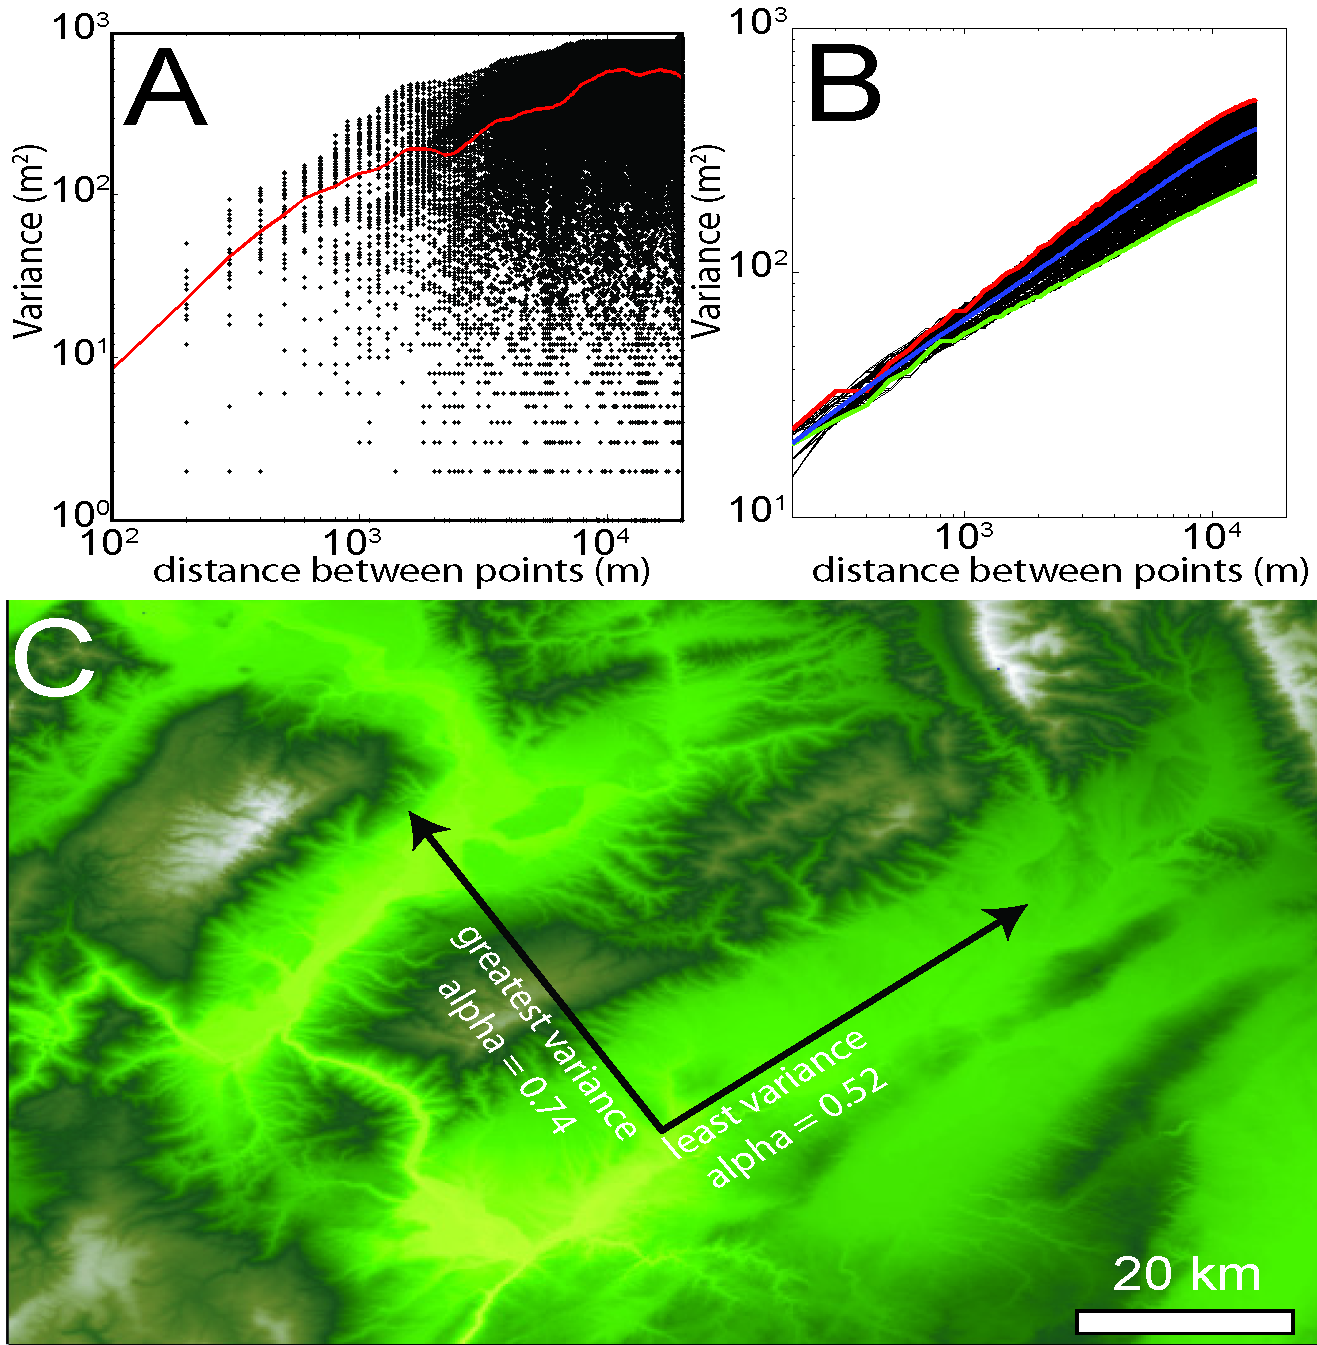
| − | + | '''Figure 10''': A) variance measured at single, randomly chosen point along 1 degree intervals for 360 degrees up to 20 km separation distance at ~100 m intervals. Black dots indicate the variance, red line indicates trend of the averaged data. B) Plot similar to A but for all points in the domain, variance values are averaged by direction to compare scaling by orientation. Maximum scaling parameter indicated in red (0.74), minimum indicated in green (0.52), mean indicated in blue. C) Map of Central Otago with the maximum and minimum scaling parameter orientations indicated. | |
Latest revision as of 17:09, 10 March 2015
Figure 10: A) variance measured at single, randomly chosen point along 1 degree intervals for 360 degrees up to 20 km separation distance at ~100 m intervals. Black dots indicate the variance, red line indicates trend of the averaged data. B) Plot similar to A but for all points in the domain, variance values are averaged by direction to compare scaling by orientation. Maximum scaling parameter indicated in red (0.74), minimum indicated in green (0.52), mean indicated in blue. C) Map of Central Otago with the maximum and minimum scaling parameter orientations indicated.
