Glacial Loading and Tectonics Figure 1
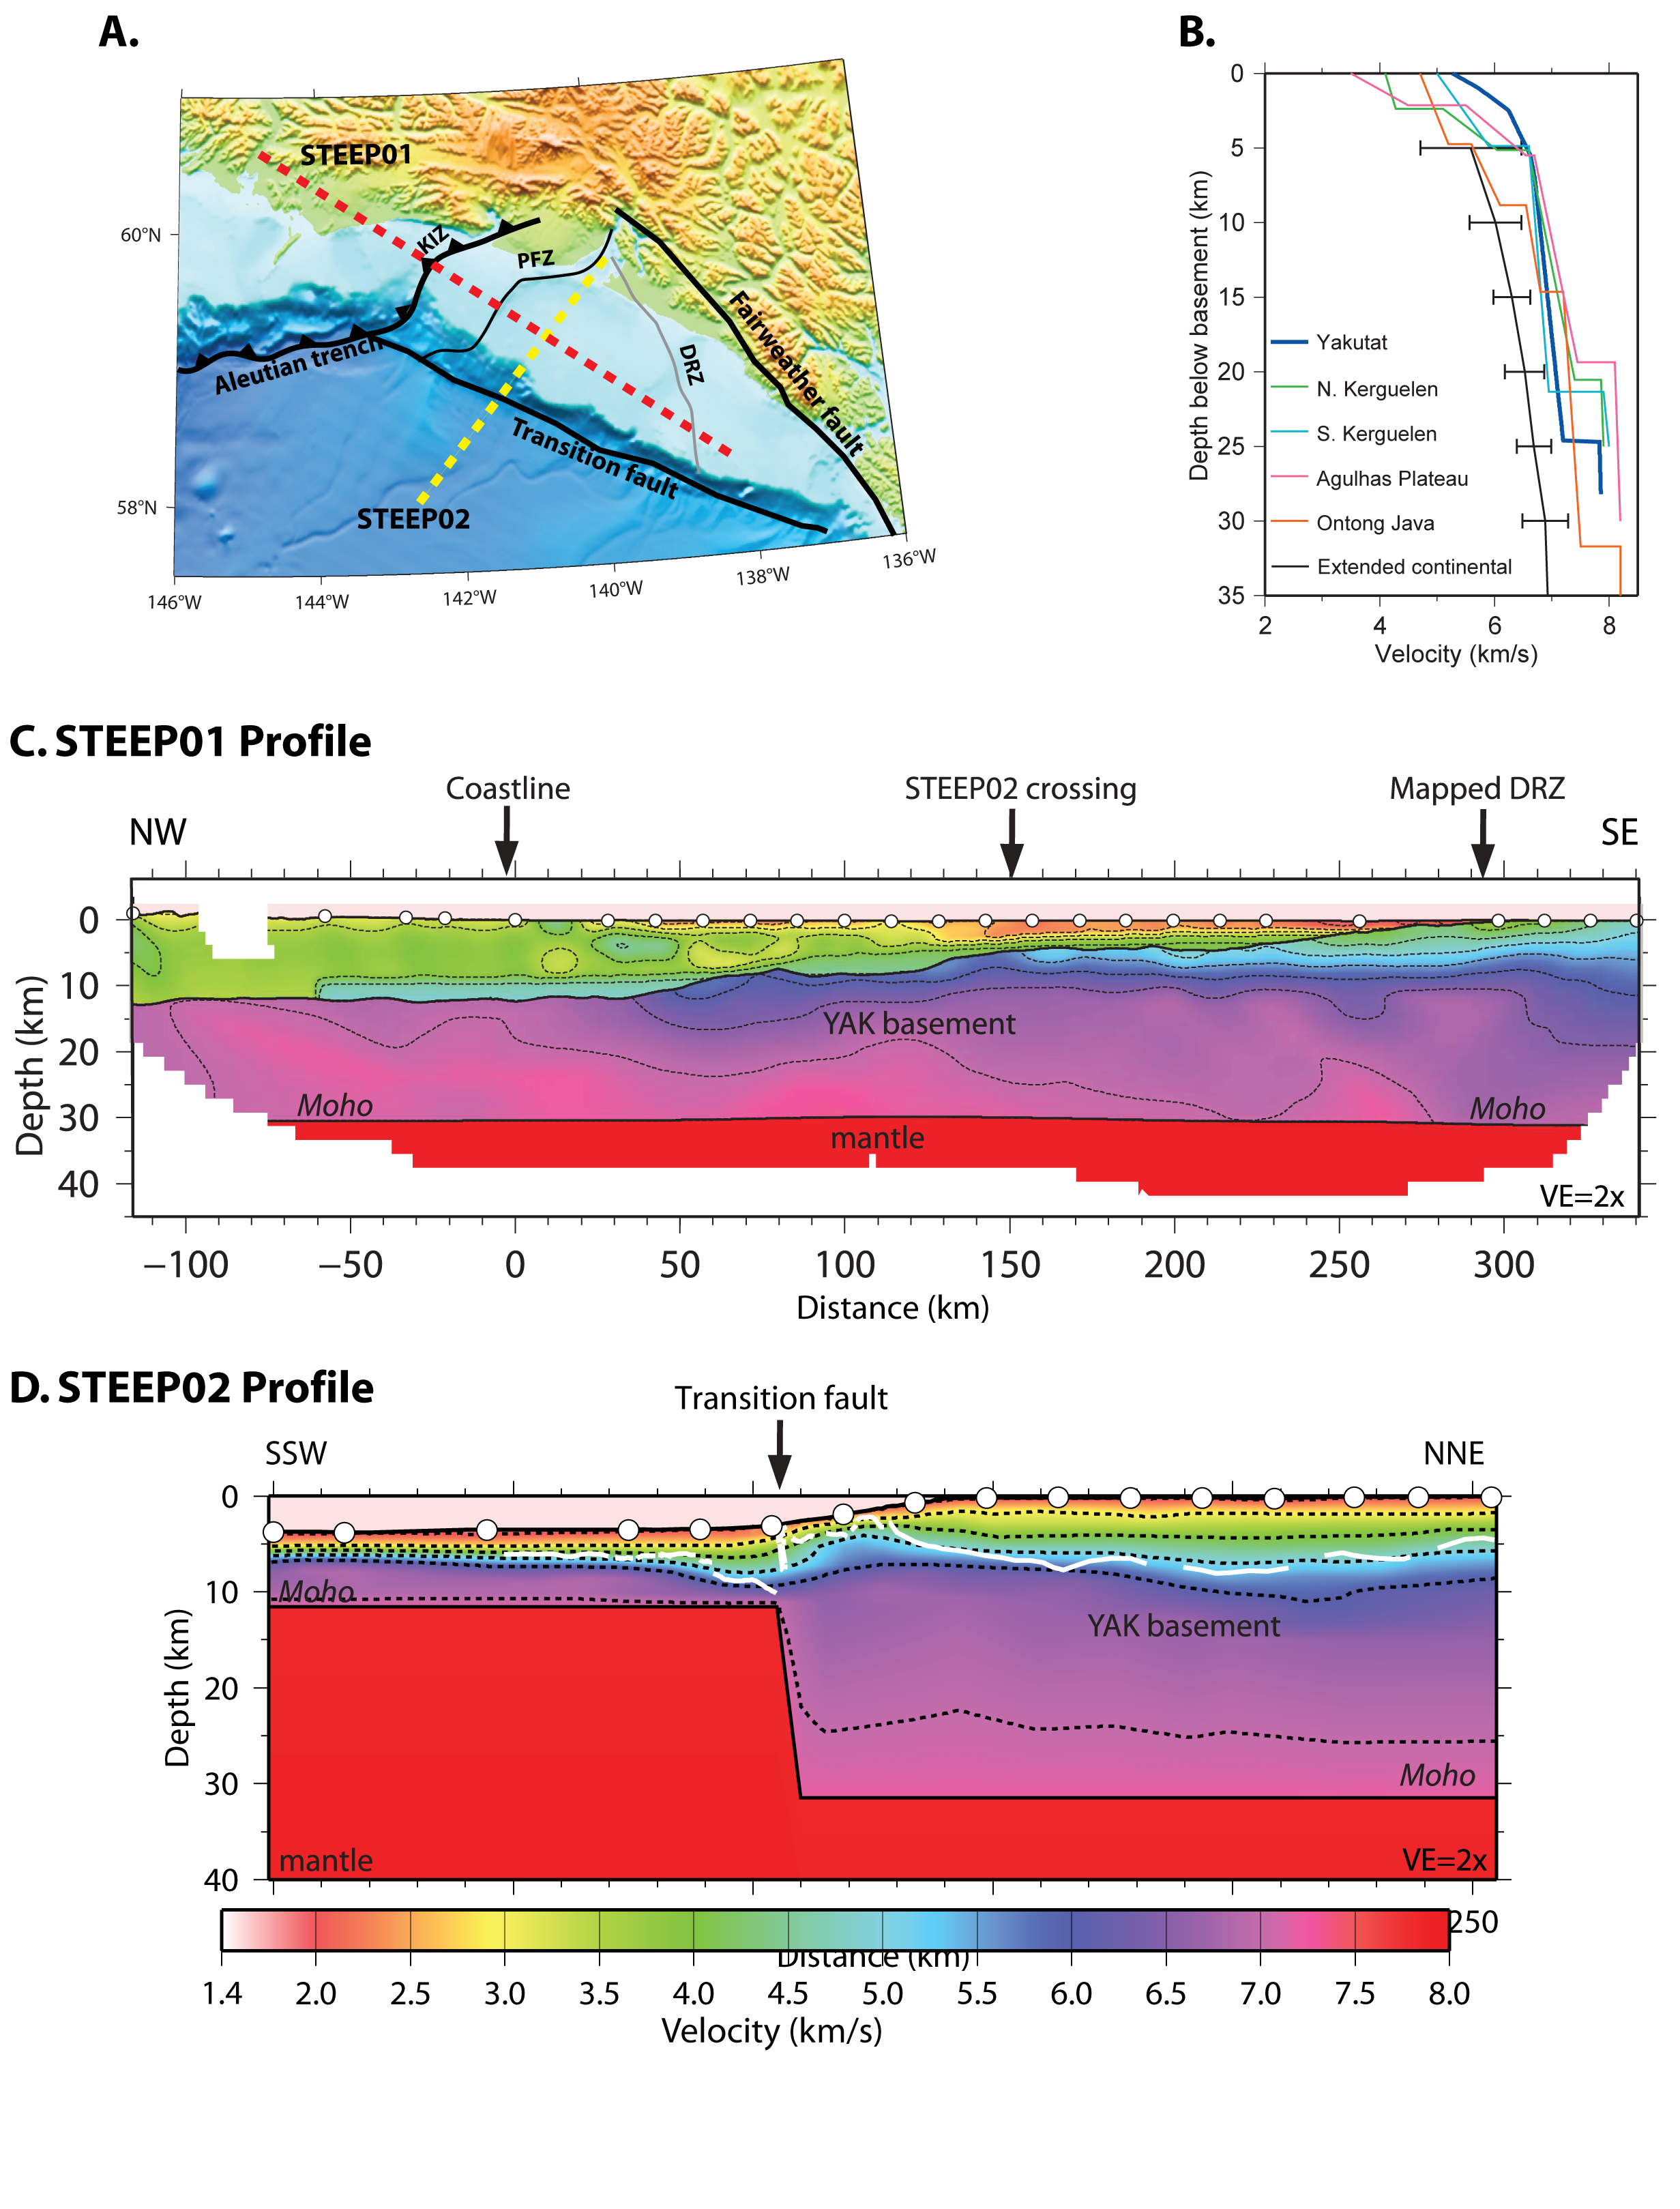
Figure 1. STEEP01 and STEEP02 refraction profiles (Worthington et al. 2012; Christeson et al. 2010).
A. Location map of local tectonics, Kayak Island Zone (KIZ), Pamplona Fault Zone (PFZ), Dangerous River Zone (DRZ), the Fairweather fault, and Transition fault, and the STEEP01 and STEEP02 transects.
B. Comparison of STEEP02 velocities with other oceanic plateaus (Christeson et al. 2010). C. Velocity model from the STEEP01 transect and D. Veloctiy model from the STEEP02 transect with the mantle, moho, and Yakutat basement. Vertical exaggeration is 2:1 for both profiles. Contour lines are 1 km/s.
