Difference between revisions of "Glacial Loading and Tectonics Figure 5"
(Created page with "center|500px") |
|||
| Line 1: | Line 1: | ||
[[File:GLTFig5.png|center|500px]] | [[File:GLTFig5.png|center|500px]] | ||
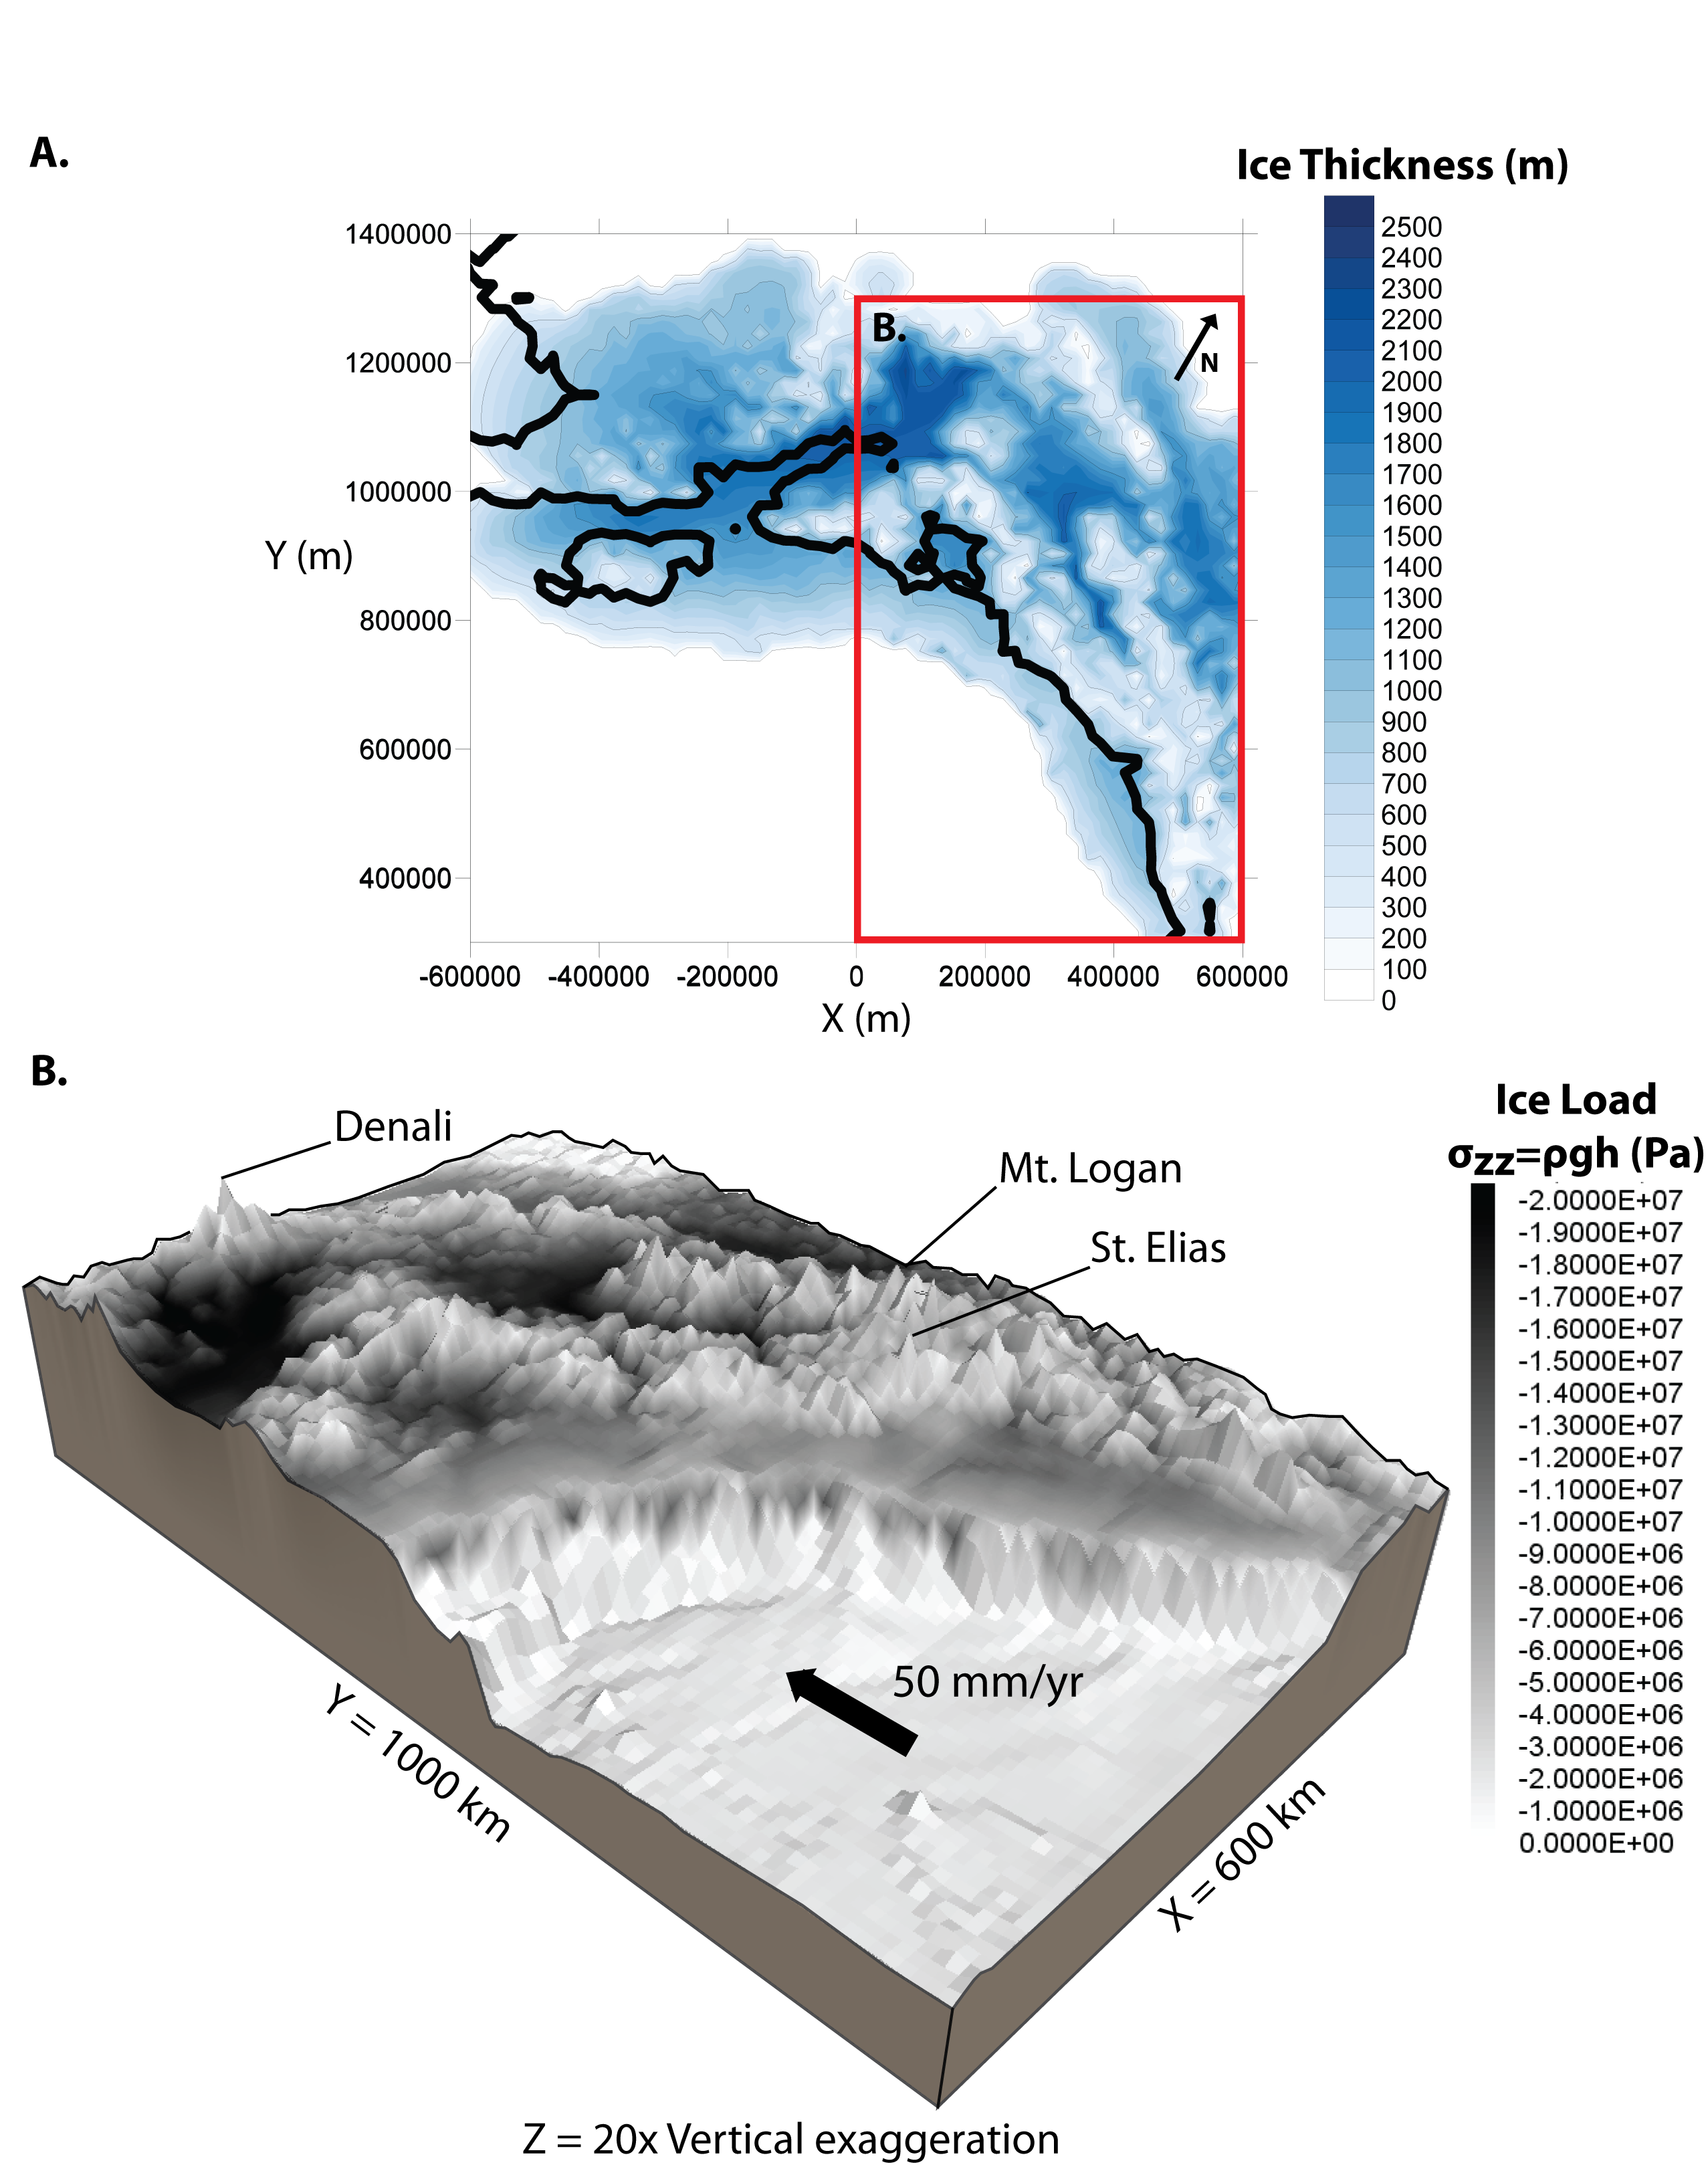
| + | '''Figure 5.''' | ||
| + | |||
| + | A. LGM ice thickness (m) output from the UMISM 116 kyr glacial cycle simulation. Black contour represents modern coast, red box represents the area used in the numerical model. | ||
| + | |||
| + | B. Ice load (Pa) calculated from the ice thickness (m) (σzz=ρgh) overlain on the model topography. The largest glacial loads are in the valleys in interior Alaska and ~200 m of ice, ~1.8x10⁶ Pa, on the Yakutat block. | ||
Latest revision as of 15:48, 18 March 2015
Figure 5.
A. LGM ice thickness (m) output from the UMISM 116 kyr glacial cycle simulation. Black contour represents modern coast, red box represents the area used in the numerical model.
B. Ice load (Pa) calculated from the ice thickness (m) (σzz=ρgh) overlain on the model topography. The largest glacial loads are in the valleys in interior Alaska and ~200 m of ice, ~1.8x10⁶ Pa, on the Yakutat block.
