Difference between revisions of "Glacial Loading and Tectonics Figure 3"
| Line 1: | Line 1: | ||
| − | [[File:GLTFig3.png|center| | + | [[File:GLTFig3.png|center|1100px]] |
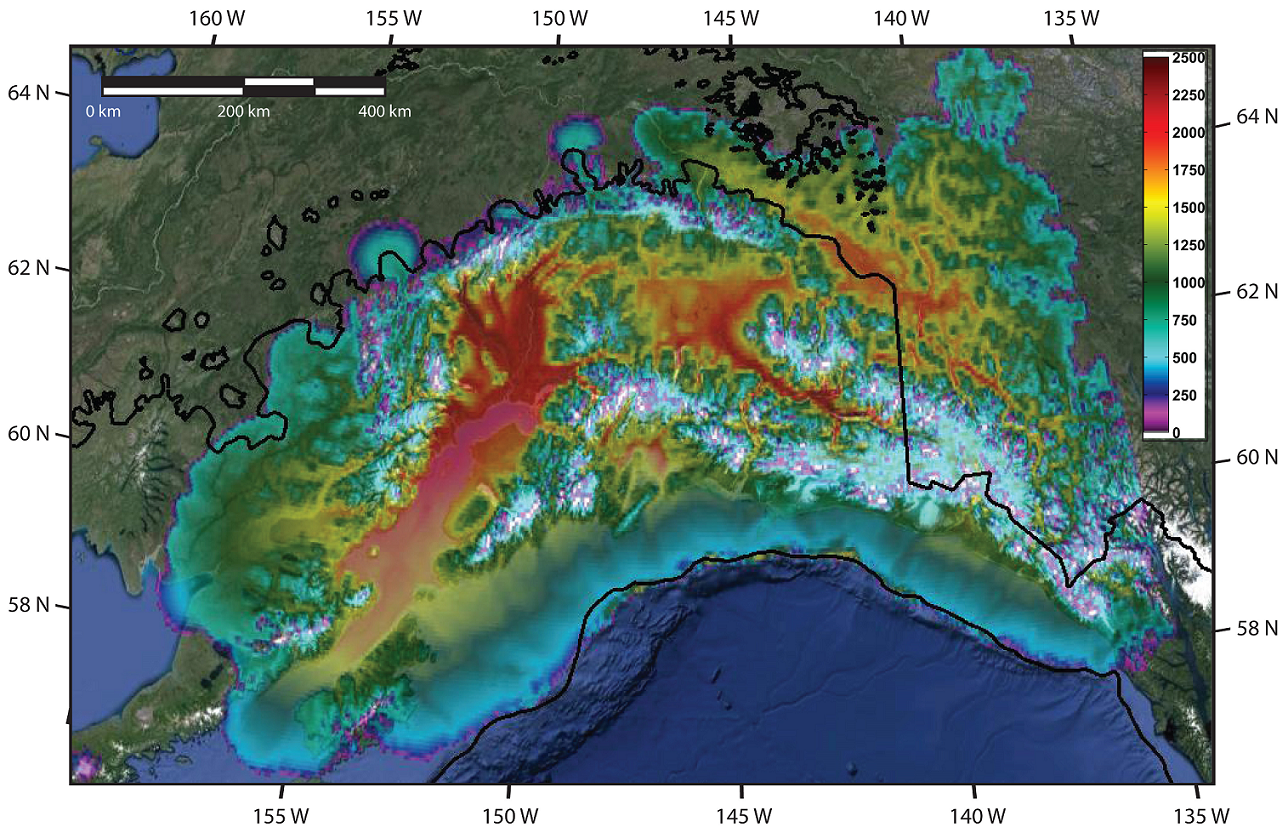
'''Figure 3.''' | '''Figure 3.''' | ||
Maximum LGM ice extent from observations (black line) (Manley and Kaufman 2002) and UMISM LGM ice thickness (m) results at 18,900 years BP overlain on Google Earth terrain. | Maximum LGM ice extent from observations (black line) (Manley and Kaufman 2002) and UMISM LGM ice thickness (m) results at 18,900 years BP overlain on Google Earth terrain. | ||
