Difference between revisions of "Topographic Anisotropy Figure 3"
| Line 1: | Line 1: | ||
| − | [[File:Vario figures copy Page 03.png|center| | + | [[File:Vario figures copy Page 03.png|center|450px]] |
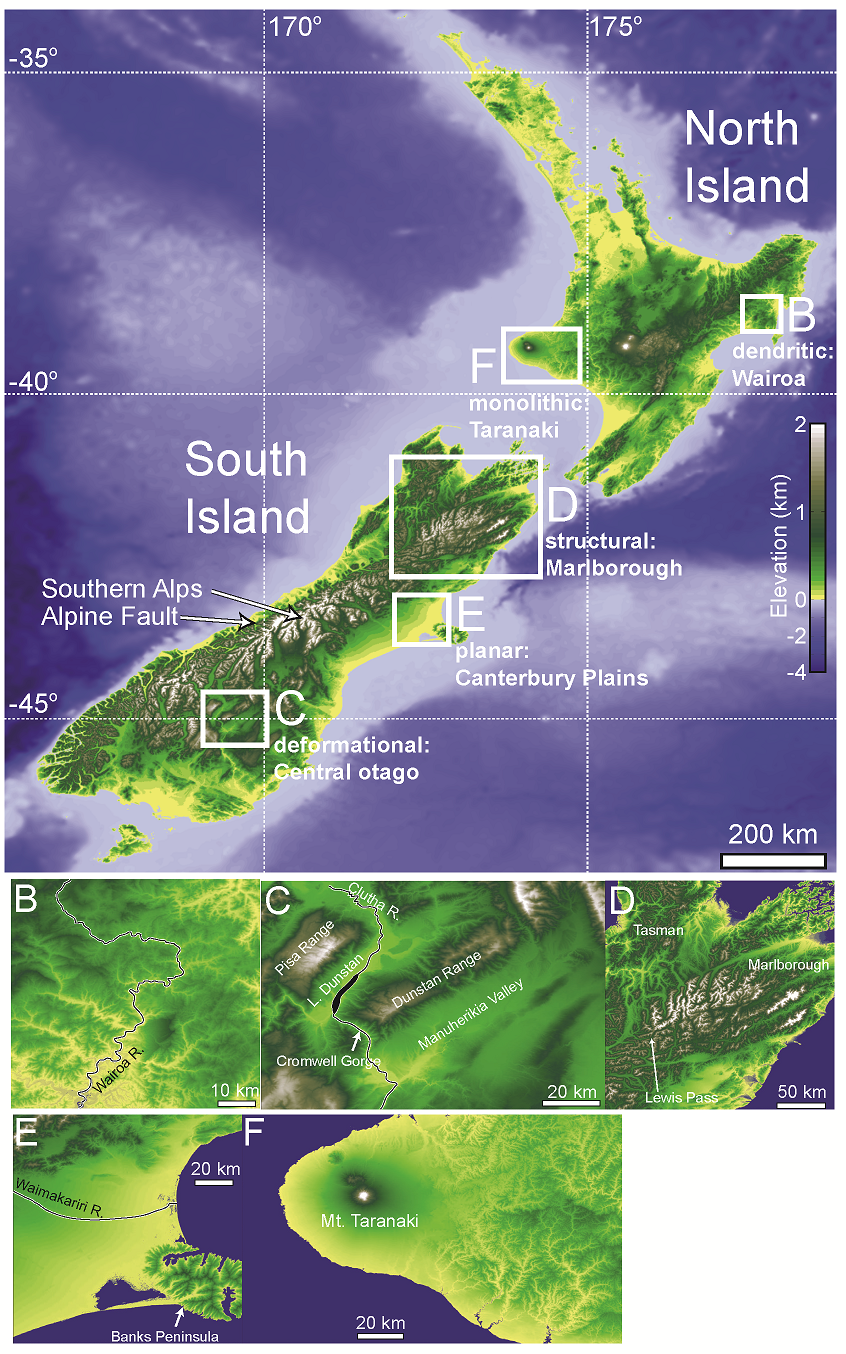
'''Figure 3''': Topographic maps of A) New Zealand and the regions of B) Wairoa, C) Central Otago, D) Marlborough, E) Canterbury Plains, and F) Taranaki. These locations are used for further analysis in Sections 2 and 3. Map A uses topographic data from the SRTM30 mission (~1 km resolution) and bathymetric data from the ETOPO1 mission (~2 km resolution). Maps B-F use topographic data from the SRTM3 mission (~90 m resolution) (Rabus et al., 2003). Please note scale change between maps and the difference in scale between bathymetric and terrestrial elevation data in map A. | '''Figure 3''': Topographic maps of A) New Zealand and the regions of B) Wairoa, C) Central Otago, D) Marlborough, E) Canterbury Plains, and F) Taranaki. These locations are used for further analysis in Sections 2 and 3. Map A uses topographic data from the SRTM30 mission (~1 km resolution) and bathymetric data from the ETOPO1 mission (~2 km resolution). Maps B-F use topographic data from the SRTM3 mission (~90 m resolution) (Rabus et al., 2003). Please note scale change between maps and the difference in scale between bathymetric and terrestrial elevation data in map A. | ||
Revision as of 17:39, 10 March 2015
Figure 3: Topographic maps of A) New Zealand and the regions of B) Wairoa, C) Central Otago, D) Marlborough, E) Canterbury Plains, and F) Taranaki. These locations are used for further analysis in Sections 2 and 3. Map A uses topographic data from the SRTM30 mission (~1 km resolution) and bathymetric data from the ETOPO1 mission (~2 km resolution). Maps B-F use topographic data from the SRTM3 mission (~90 m resolution) (Rabus et al., 2003). Please note scale change between maps and the difference in scale between bathymetric and terrestrial elevation data in map A.
