Difference between revisions of "Topographic Anisotropy Figure 7"
(Created page with " '''Figure 7''': A) Plane gently dipping southeast; a simplified replication of low relief planar topography found in Canterbury Plains. B) Anisotropy measured at single poin...") |
|||
| Line 1: | Line 1: | ||
| − | + | [[File:Vario figures copy Page 07.png]] | |
| − | |||
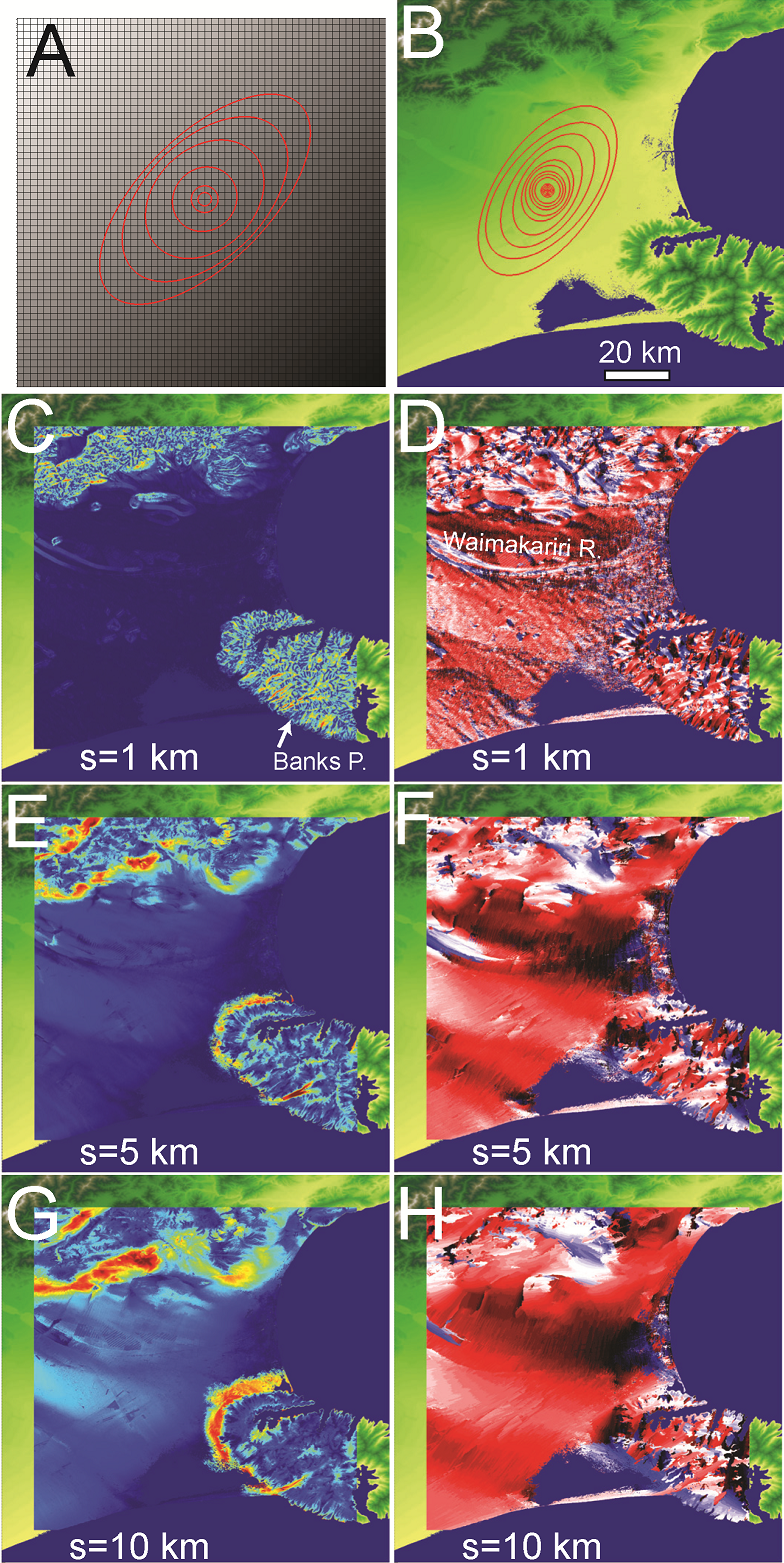
'''Figure 7''': A) Plane gently dipping southeast; a simplified replication of low relief planar topography found in Canterbury Plains. B) Anisotropy measured at single point in center of Canterbury Plains delta. Anisotropy measured up to maximum wavelength of 25 km. C) Anisotropy magnitude and D) orientation map at 1 km, E) F) 5 km, and G) H) 10 km wavelength. | '''Figure 7''': A) Plane gently dipping southeast; a simplified replication of low relief planar topography found in Canterbury Plains. B) Anisotropy measured at single point in center of Canterbury Plains delta. Anisotropy measured up to maximum wavelength of 25 km. C) Anisotropy magnitude and D) orientation map at 1 km, E) F) 5 km, and G) H) 10 km wavelength. | ||
Revision as of 17:43, 10 March 2015
 Figure 7: A) Plane gently dipping southeast; a simplified replication of low relief planar topography found in Canterbury Plains. B) Anisotropy measured at single point in center of Canterbury Plains delta. Anisotropy measured up to maximum wavelength of 25 km. C) Anisotropy magnitude and D) orientation map at 1 km, E) F) 5 km, and G) H) 10 km wavelength.