Difference between revisions of "Glacial Loading and Tectonics Figure 4"
(Created page with "center|400px") |
|||
| (3 intermediate revisions by the same user not shown) | |||
| Line 1: | Line 1: | ||
| − | [[File:GLTFig4.png|center| | + | [[File:GLTFig4.png|center|460px]] |
| + | '''Figure 4.''' | ||
| + | |||
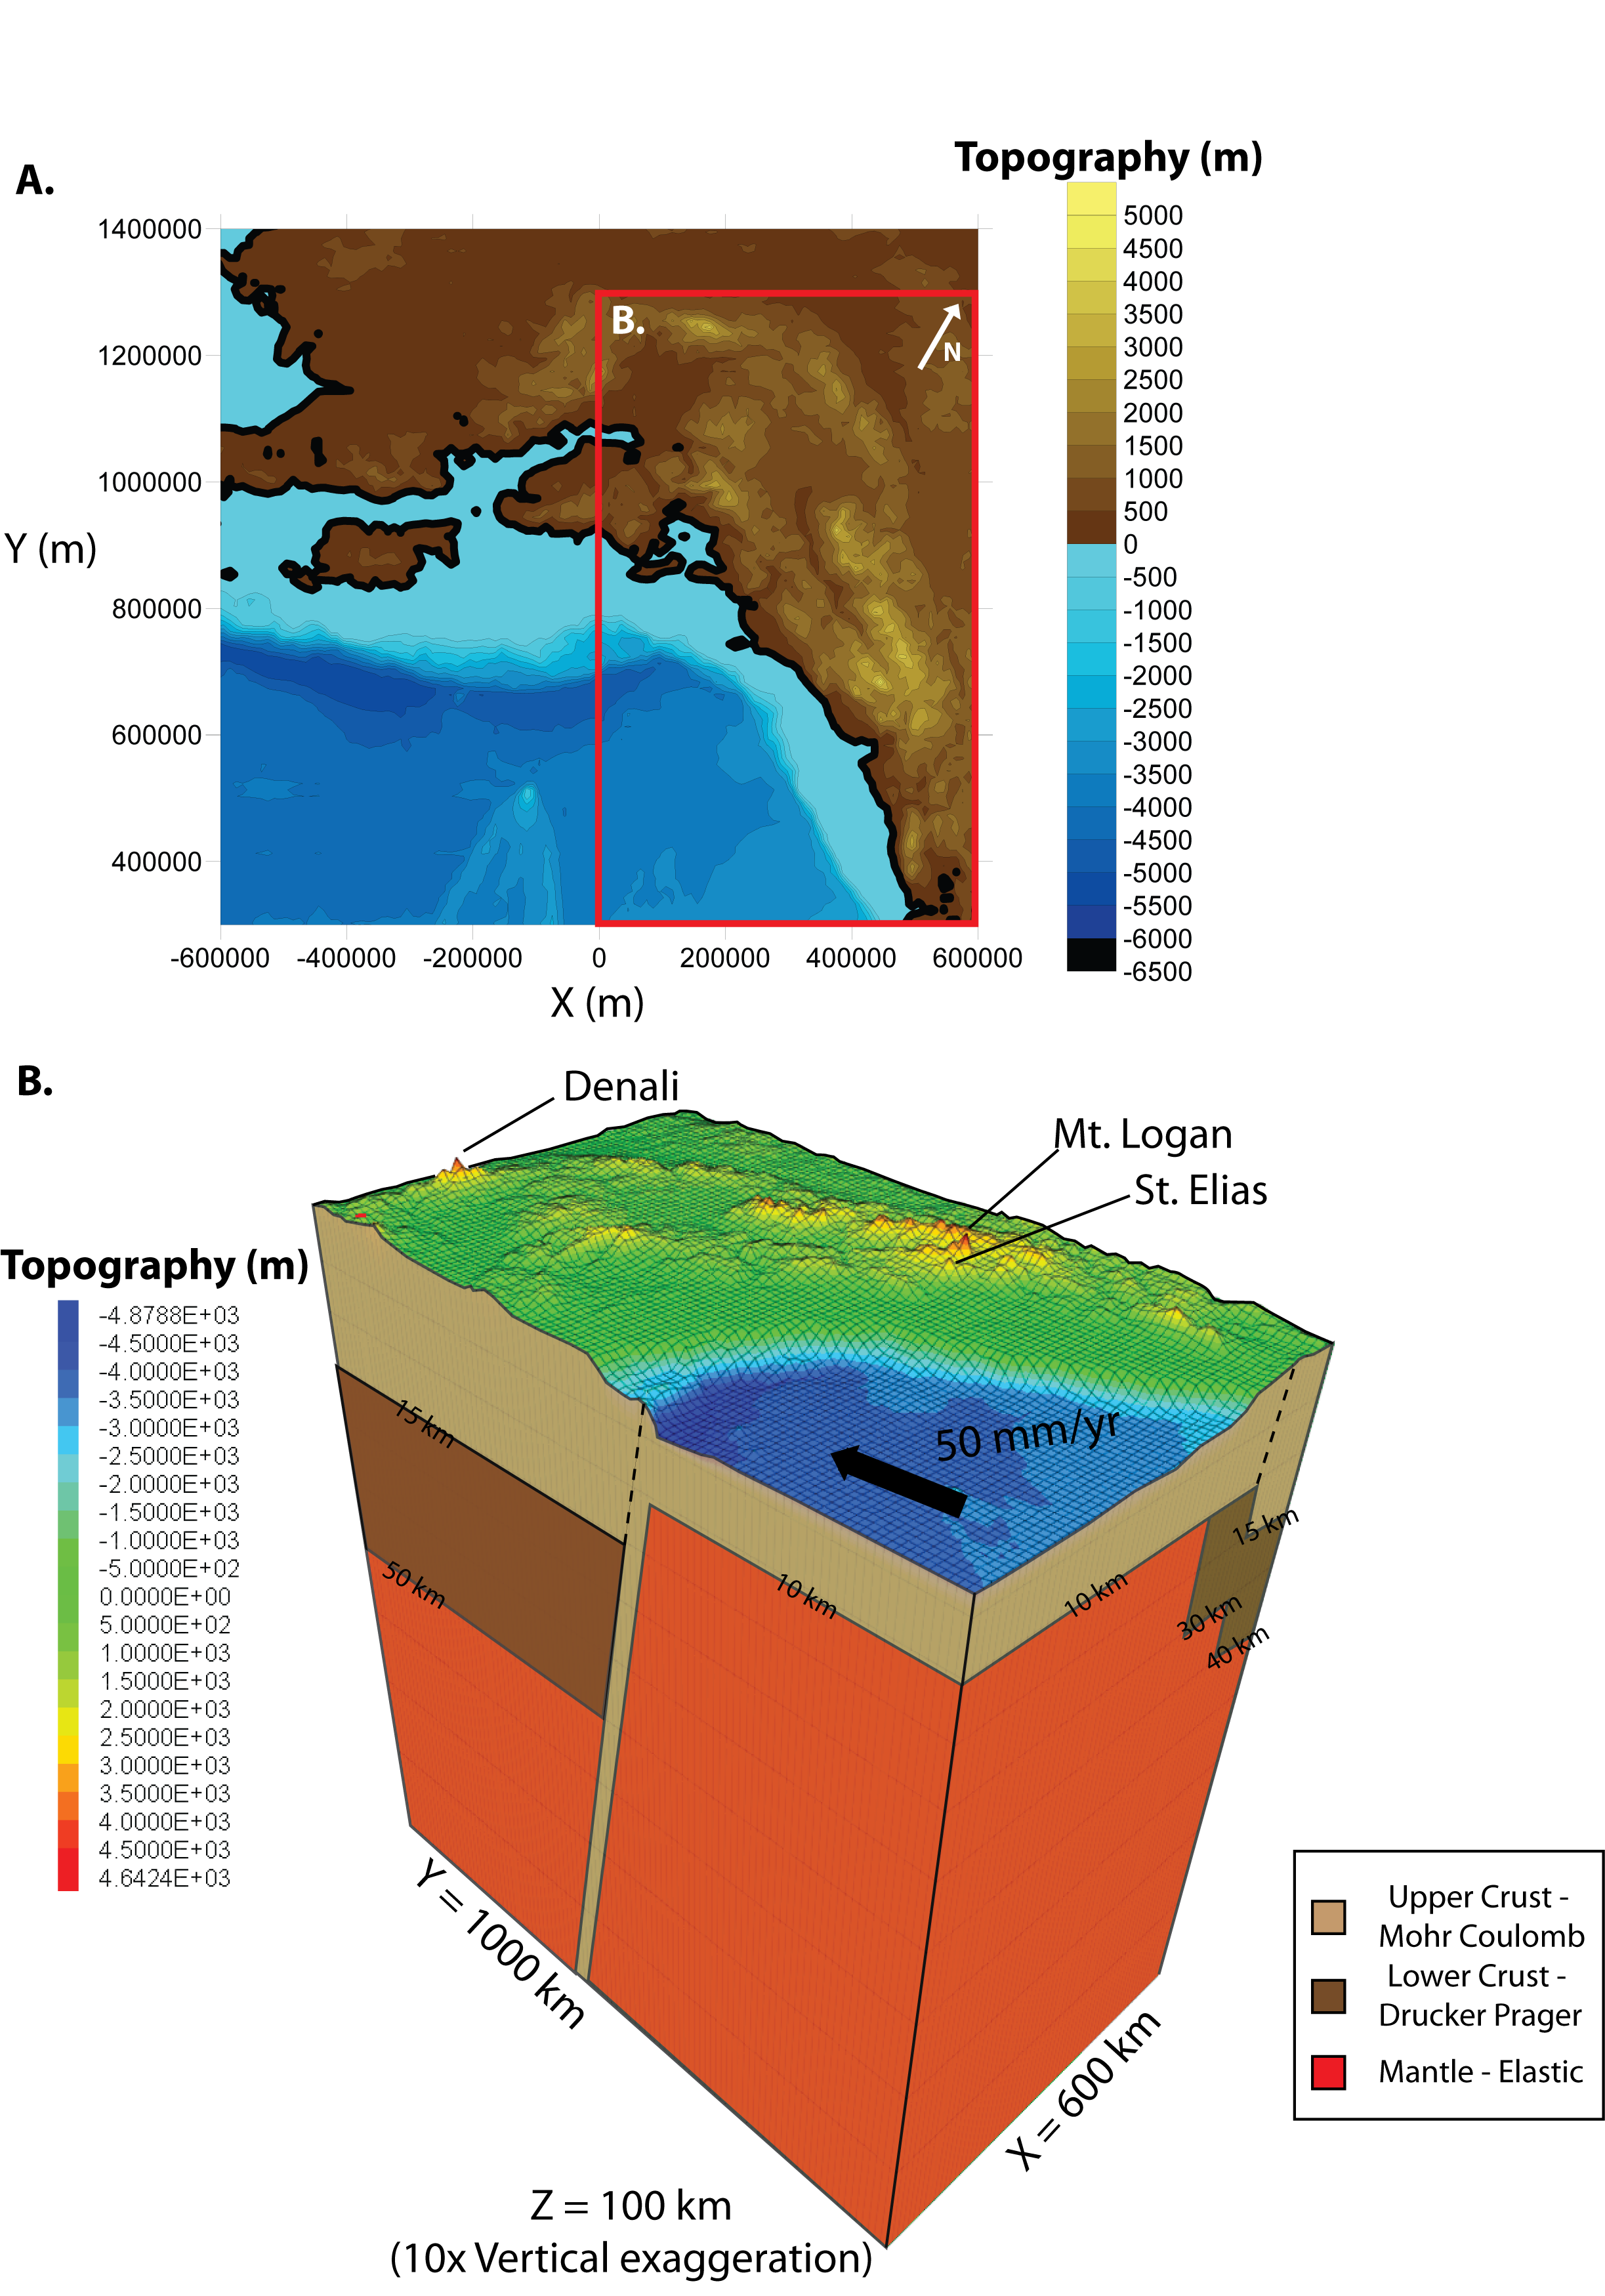
| + | A. Modern Alaska topography (m) at 10 km resolution sampled from 30 m SRTM DEM. Black contour represents modern coast, red box represents the area used in the numerical model. | ||
| + | |||
| + | B. Model geometry with topography (m) at 10 km horizontal resolution. Z-axis is vertically exaggerated 10X. The upper crust is defined by a pressure dependent Mohr-Coulomb model (light brown), the lower crust is defined by a temperature dependent Drucker-Prager model (dark brown), and the mantle is defined by an Elastic model (red). | ||
Latest revision as of 16:06, 18 March 2015
Figure 4.
A. Modern Alaska topography (m) at 10 km resolution sampled from 30 m SRTM DEM. Black contour represents modern coast, red box represents the area used in the numerical model.
B. Model geometry with topography (m) at 10 km horizontal resolution. Z-axis is vertically exaggerated 10X. The upper crust is defined by a pressure dependent Mohr-Coulomb model (light brown), the lower crust is defined by a temperature dependent Drucker-Prager model (dark brown), and the mantle is defined by an Elastic model (red).
