Difference between revisions of "Glacial Loading and Tectonics Figure 2"
| Line 1: | Line 1: | ||
| − | [[File:GLTFig2.png|center| | + | [[File:GLTFig2.png|center|1150px]] |
'''Figure 2.''' | '''Figure 2.''' | ||
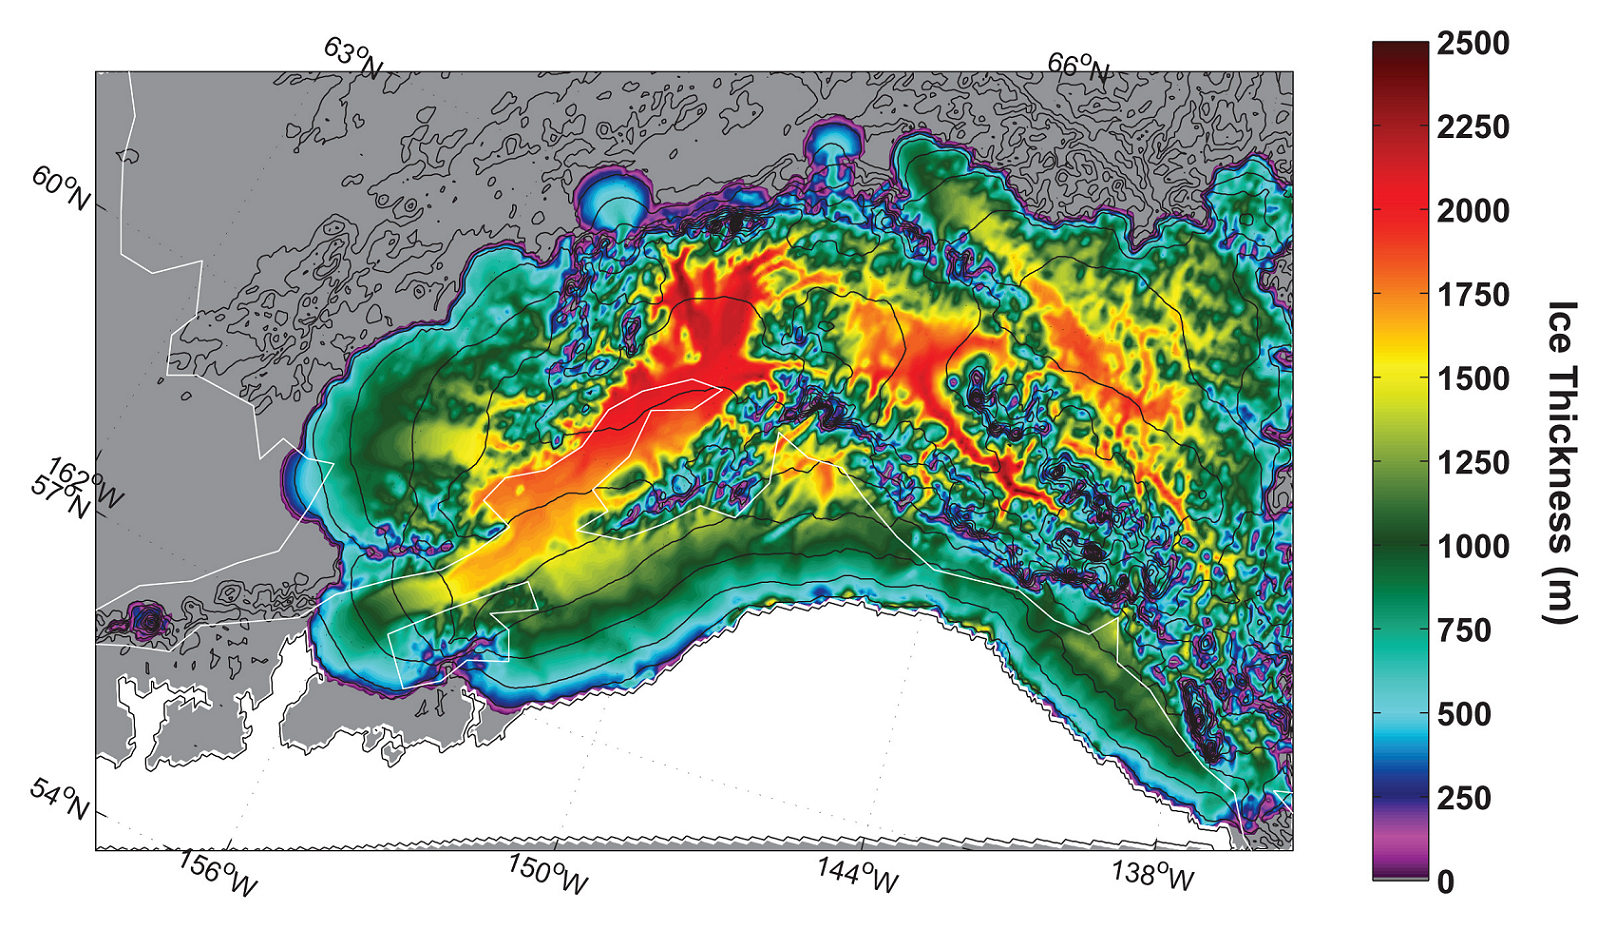
Maximum ice extent during the Last Glacial Maximum (at 18,900 years BP) modeled using the University of Maine Ice Sheet Model (UMISM) for the last glacial (~116 ka). Base precipitation and temperature grids are hybrid, derived from WorldClim (Hijmans et al. 2005) over land areas, and NCEP/NCAR Reanalysis (Kalnay et al., 1996) over ocean areas. The annual averages for both WorldClim and NCEP precipitation and temperature used for base climate (http://cci-reanalyzer.org, Personal communication, Sean Birkel). | Maximum ice extent during the Last Glacial Maximum (at 18,900 years BP) modeled using the University of Maine Ice Sheet Model (UMISM) for the last glacial (~116 ka). Base precipitation and temperature grids are hybrid, derived from WorldClim (Hijmans et al. 2005) over land areas, and NCEP/NCAR Reanalysis (Kalnay et al., 1996) over ocean areas. The annual averages for both WorldClim and NCEP precipitation and temperature used for base climate (http://cci-reanalyzer.org, Personal communication, Sean Birkel). | ||
Latest revision as of 15:46, 18 March 2015
Figure 2. Maximum ice extent during the Last Glacial Maximum (at 18,900 years BP) modeled using the University of Maine Ice Sheet Model (UMISM) for the last glacial (~116 ka). Base precipitation and temperature grids are hybrid, derived from WorldClim (Hijmans et al. 2005) over land areas, and NCEP/NCAR Reanalysis (Kalnay et al., 1996) over ocean areas. The annual averages for both WorldClim and NCEP precipitation and temperature used for base climate (http://cci-reanalyzer.org, Personal communication, Sean Birkel).
